Executive Dashboards
Know your exact gross margins, crew efficiency, and operational bottlenecks at a glance—updated automatically, without waiting on manual end-of-month spreadsheets.
Capabilities
Metrics Executives Commonly Track
Executive dashboards can consolidate financial, operational, sales, service, and performance data into a single source of truth for leadership.
From Delayed Reporting To Real-Time Visibility
Before Executive Dashboards
- • Reports are compiled manually
- • Data lives in multiple systems
- • Management waits for updates
- • Profitability is difficult to track
- • Operational issues go unnoticed
- • Staff prepare recurring reports
- • Decisions rely on outdated information
- • Performance trends are hidden
After Executive Dashboards
- • Metrics update automatically
- • Data is centralized
- • KPIs are visible instantly
- • Profitability is monitored continuously
- • Bottlenecks are identified early
- • Reporting is automated
- • Decisions are data-driven
- • Performance trends are always visible
How Executive Dashboards Works
Connect
Data is collected from CRM systems, accounting platforms, operational software, spreadsheets, and custom databases.
Consolidate
Information is standardized, cleaned, and organized into meaningful business metrics and performance indicators.
Visualize
Dashboards present profitability, operational performance, labor utilization, sales activity, and business KPIs in real time.
Monitor
Leadership gains continuous visibility into trends, bottlenecks, risks, and opportunities without manual reporting.
Dashboard Pipeline
Business Intelligence Data Flow
Visual Tour
What The System Looks Like
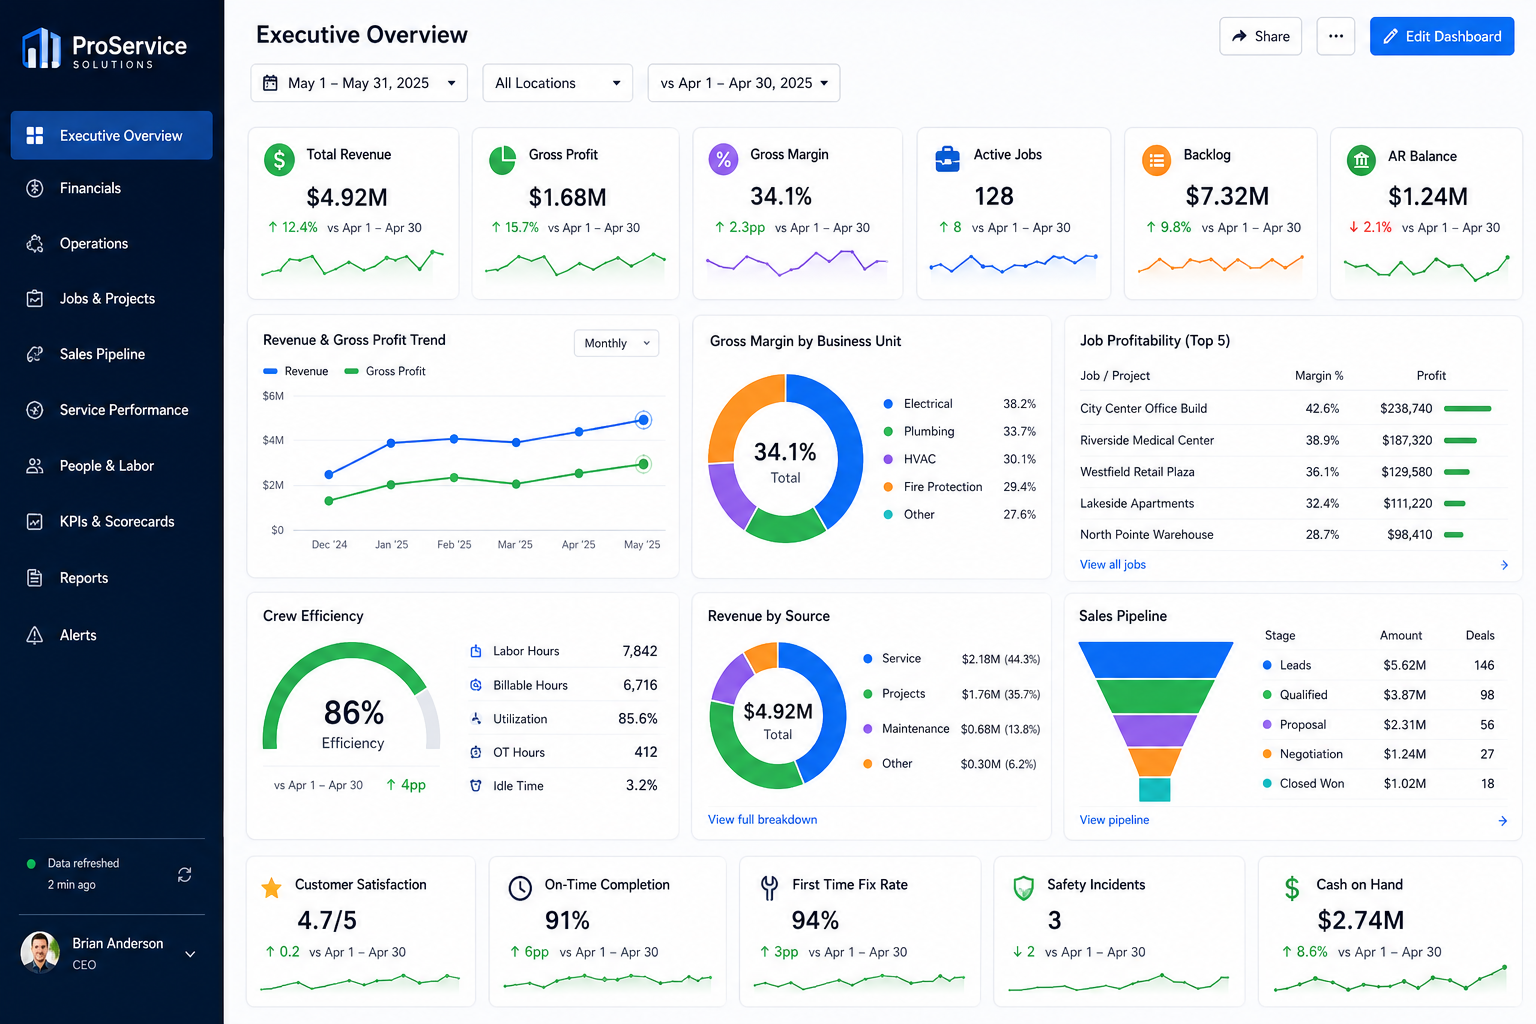
Executive Overview
View critical business KPIs, profitability metrics, operational performance, and growth indicators from a centralized dashboard.
Operational Insights
Monitor crews, projects, service delivery, sales activity, and operational trends in real time.
Performance Reporting
Track margins, utilization, bottlenecks, forecasts, and business health without manual reporting cycles.
Reporting Solutions
Common Executive Dashboard Systems
Job Profitability Dashboards
Track revenue, labor costs, materials, and margins across active projects before issues become expensive.
Operations Performance Dashboards
Monitor crews, dispatch activity, service delivery, productivity, and operational efficiency from one location.
Executive KPI Dashboards
Provide leadership with high-level visibility into business performance, growth, and operational health.
Sales Performance Dashboards
Track leads, pipeline activity, conversion rates, revenue forecasts, and sales team performance.
Financial Reporting Dashboards
Monitor profitability, cash flow indicators, accounts receivable, and financial performance metrics.
Multi-Location Reporting
Compare operational performance, revenue, and profitability across locations, divisions, or business units.
Impact
Typical Operational Improvements
Real-Time Visibility
Access live business metrics instead of waiting for manually assembled reports.
Faster Decision Making
Identify issues, trends, and opportunities as they happen.
Improved Accountability
Provide teams and leadership with shared visibility into performance metrics.
Reduced Reporting Work
Eliminate repetitive spreadsheet creation and manual report compilation.
Better Profitability Tracking
Monitor margins, costs, and operational performance before problems escalate.
Operational Clarity
See exactly where bottlenecks, inefficiencies, and opportunities exist across the organization.
Compatibility
Built Around Existing Business Systems
Executive dashboards are only as valuable as the data feeding them.
Most implementations connect directly to CRM platforms, accounting systems, operational software, spreadsheets, dispatch tools, and reporting databases.
The goal is to provide a complete business view without requiring teams to change how they already work.
FAQ
Frequently Asked Questions
Q: Can dashboards pull data from multiple systems?
Q: Can metrics update automatically?
Q: Can dashboards be customized for different roles?
Q: Can we track profitability by project or customer?
Q: What if our reporting requirements change?
Related Services
Connected Infrastructure
Still Waiting Weeks For Critical Business Reports?
Leadership decisions are only as good as the visibility behind them. Executive dashboards provide real-time insight into profitability, operations, sales performance, and business health.